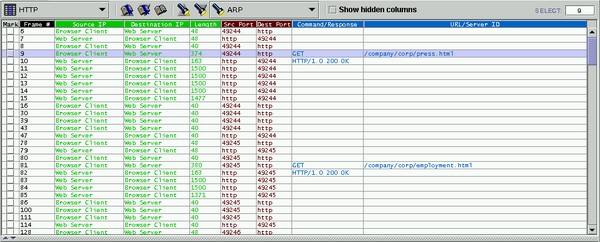
This interactive view displays a listing of the records in the trace file which currently is loaded. The user may change the set of columns displayed by selecting from any of the Overview Report templates available, or may create new reports as necessary. Functions associated with this view include:
Certain cells in a data column may contain no data at all. This simply indicates that the record being represented by the row in question does not contain data matching the data required by that column. For example, if a report column is used to display a TCP source port number, and a record is encountered which is not a TCP/IP frame (and therefore does not contain a TCP header with the source port number), no information will be displayed for that record in that column.
Since trace files may contain records composed of a wide variety of protocols, report templates are likely to contain columns which require data from protocols which may or may not appear in all records in a given trace. This can lead to a situation where a report contains many blank cells and is difficult to read. Two functions are built into the Trace Analyzer to help overcome this difficulty:
To draw a distinction between report templates and data filters, the report template affects which columns (i.e., protocol data fields) are being viewed, while the data filter affects which rows (i.e., trace records) are being viewed.The last report template to be selected during a Trace Analyzer session will be the template displayed the next time the application is started, unless overridden by the user with the -report command line option.
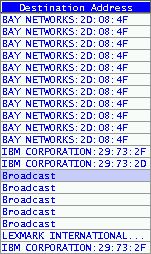
Figure 2. Interpreted Data Mode |
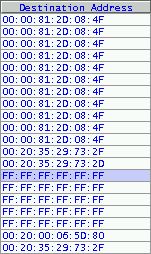
Figure 3. Raw Data Mode |
Report columns which are defined to display interpreted data will first apply any end-user symbolic name aliases to the raw data. If none are found to match the data, the standard interpretation supplied by the program's protocol definitions, if any, is applied. If at this point, still no interpretation has been applied, the raw data is displayed in the column, formatted according to that column's format clause.
Note: Interpreted data mode can be set globally
via the Use aliases checkbox in the ![]() Configure - Preferences dialog window.
Configure - Preferences dialog window.
|
|
Action | Description |
|
|
Select Report Template | This combo box allows the user to select the current report template to apply to the Overview Report from a list of preconfigured report templates. The Overview Report is immediately refreshed upon the selection of a new report. |
|
|
Select Previous Bookmark | Clicking this icon moves the current row selection backwards to the closest, previous, bookmarked record. The search for the previous bookmarked record begins at the currently selected record, whether or not it is bookmarked. The search will not wrap around to the end of the trace. |
|
|
Select Next Bookmark | Clicking this icon moves the current row selection forwards to the closest, next, bookmarked record. The search for the next bookmarked record begins at the currently selected record, whether or not it is bookmarked. The search will not wrap around to the beginning of the trace. |
|
|
Toggle Bookmark View | This control toggles between the two icons displayed. When in its first state, clicking on this icon will cause the Overview Report to display only bookmarked records. When in its second state, clicking on this icon will cause the Overview Report to revert back to displaying both marked and unmarked records. |
|
|
Find Previous | Clicking this icon causes the search engine to apply the data filter selected in the "Select Find Filter" combo box in reverse order to each record previous to the currently selected row. The first row which contains a record which is accepted by the data filter is selected. At this point the search ends. If no record is found which matches the data filter's criteria, the search ends unsuccessfully. The search will not wrap around to the end of the trace. |
|
|
Find Next | Clicking this icon causes the search engine to apply the data filter selected in the "Select Find Filter" combo box in forward order to each record following to the currently selected row. The first row which contains a record which is accepted by the data filter is selected. At this point the search ends. If no record is found which matches the data filter's criteria, the search ends unsuccessfully. The search will not wrap around to the beginning of the trace. |
|
|
Select Find Filter | This combo box is used to select a data filter to apply in all subsequent "Find" operations, from a list of preconfigured data filters. |
|
|
Show Hidden Columns | Overview Reports may contain data columns which are normally hidden from view. Selecting this checkbox displays those columns. Deselecting this checkbox hides those columns. See also the Customizing Reports - Column Attribute Components section. |
|
|
Select Row | The user may type a record number into this entry field and press the <Enter> key. If the record number which the user entered exists in the current Overview Report view, it is selected. If not, the closest available record (previous or next) is selected instead. This entry field is automatically updated whenever the Overview Report row selection changes. |
The Trace Analyzer supports bookmarking any number of records, up to the total number of records in a trace. The same set of bookmarks is maintained, regardless of any data filter which may be applied against the trace data. Bookmarked records which are excluded by a particular data filter simply are not displayed in the Overview Report when that filter is applied; however, these records remain bookmarked.
A list of bookmarks for a given trace file is maintained persistently
between Trace Analyzer sessions in a configuration file. Trace
files are not edited to retain bookmark information. Please
note that any list of bookmarks in the configuration file is always associated
with a particular trace file by that file's fully qualified pathname.
If that trace file is moved to another directory, this association is broken
and bookmark information for that trace file is lost.