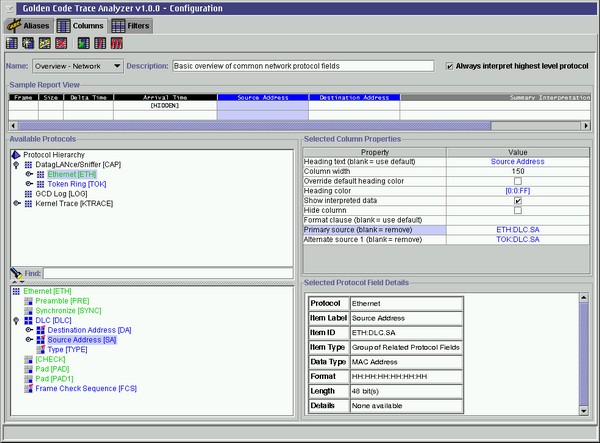
This interface consists a number of related components which are used to configure report templates. These components are organized conceptually as follows:
|
|
Action | Description |
|
|
Create New Template | Prompts the user for a report template name and creates a new template containing no columns initially. Template name must be unique. The new template is displayed and is ready for editing. |
|
|
Clone Current Template | Prompts the user for a report template name and creates a copy of the currently displayed report template which uses the new name. Template name must be unique. The template copy is displayed and is ready for editing. |
|
|
Rename Current Template | Prompts the user for a report template name and applies the new name to the currently displayed report template. Template name must be unique. |
|
|
Delete Current Template | Prompts the user for confirmation, then permanently deletes the currently displayed report template. |
|
|
Add Column | Adds a column to the end of the currently displayed report template. The new column's data source is the protocol field currently highlighted in the Available Protocols component. The column's properties default to values provided by that protocol field. |
|
|
Delete Selected Column | Deletes the column currently highlighted in the Sample Report View. |
|
|
Delete All Columns | Clears the currently displayed report template by deleting all of its columns. |
The report template may be manipulated using this view as follows:
Two types of report columns may be defined for a report template:
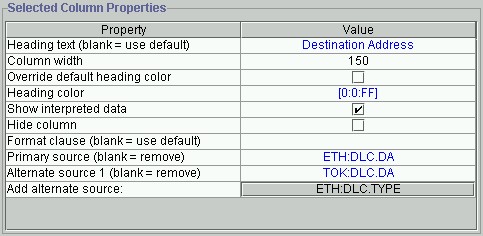
The properties of the selected report column may be edited from this view. The properties are defined in Table 2.
| Property Name | Meaning | How to Edit |
| Heading text | Text which appears in column header. | Click on Value cell for this row and type new text value. |
| Column width | Width of the column in pixels. | Click on Value cell for this row and type new width value;
or
Drag right edge of column header in Sample Report View. |
| Heading color | Color applied to the column header. | Select checkbox in Override default heading color row if not already selected; click button which appears in this row's Value cell; select a color from the color selection dialog window which appears. |
| Show interpreted data | Toggle between raw vs. interpreted data display mode for the column. | Select/deselect checkbox in Value cell. |
| Hide column | Marking a column as hidden ensures that column is only displayed when Show Hidden Columns is enabled in Overview Report. | Select/deselect checkbox in Value cell. |
| Format clause* | Override the default format clause of the primary data source for this column with the format clause specified. | Click on Value cell for this row and type new format clause; remove current value to use default format clause for primary data source. |
| Primary source* | Defines the protocol group or field which will first be checked for data to display in this column; if not present, the alternate source(s), if any, will be checked. | Edit current primary source. Click on Value cell
for this row and type the fully qualified protocol
field ID for the new protocol group or field to be used as the primary
data source for this column.
Remove the current primary source. Click on Value cell for this row and remove all text from the Value cell for this row; the next alternate source becomes the primary source. Note: this action is only permitted if an alternate source has been defined. |
| Alternate source n* | Defines the protocol group or field which will be checked for data to display in this column, if the primary source returned no data. There may be zero or more alternate data sources; they are checked for data in the order defined here. | Add a new alternate source. Click on the button
appearing in the Value cell in the Add alternate source row.
The protocol field ID appearing on the button represents the protocol group
or field which will be added as an alternate source. This ID changes
as different protocol fields are selected in the Protocol
Layout Tree component.
Remove an alternate source. Click on Value cell for this row and remove current value. Change an alternate source. Click on Value cell for this row and edit current value. The new value must be a valid, fully qualified protocol field ID. |