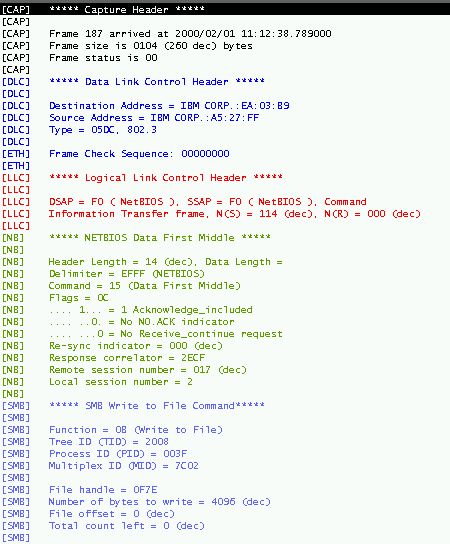
Figure 1. Example of Detailed Interpretation Report
Each protocol contained in the record is interpreted. This interpretation includes the data deemed most significant by the protocol specialists which provide protocol definitions for the Trace Analyzer.
Each line of the report has a brief section identifier in its left margin. Generally, there is a one to one correspondence between this identifier and the protocol being interpreted in that section. The color of the text in a particular section corresponds with the color the protocol definer has selected to represent the associated protocol.
The Capture Section. The very first section presents information about the capture-level protocol, which is necessarily the outermost protocol. This protocol represents the file-level format of an individual record in the trace file. It is an artificial layer which links a record's data to the trace file in which that record has been captured. Typically, this layer includes timestamp and record size information. It may include additional information, depending upon the file format of the trace file.
Record Data Interpretation Sections. The sections following the capture section describe the remaining protocol layers within the current record. The data contained within each section is specific to the protocol being decoded.
Uninterpreted Data Indicator. Finally, if after decoding a trace record, data remains uninterpreted after the last (innermost) protocol, a line is added to the end of the report to indicate this condition. This line will appear as
[DATA] n byte(s) of ininterpreted payload datawhere n is the number of bytes of uninterpreted data remaining for that particular record. This condition can occur as the result of one of several factors:
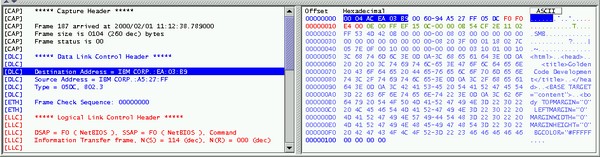
Linkage to Hex Dump Report. Selecting a line in the report inverts the color scheme for that line. In addition, selecting certain lines has an effect on the rendering of the Hex Dump Report. Specifically, if a line in the detailed interpretation report uses data from the trace record to compose its interpretation (as opposed to being static text), the individual bytes which were used to devise that interpretation are highlighted in the hex dump report. For example, in Figure 1, if the line containing the text
[DLC] Destination Address = IBM CORP.:EA:03:B9is selected, the six bytes corresponding to the Destination MAC Address in the hex dump report will be highlighted, as shown in Figure 2. Likewise, if the Uninterpreted Data Indicator line is selected, the corresponding uninterpreted bytes will be highlighted in the hex dump.
Automatic Selection of Section Headings. When the user selects a new record in the Overview Report, one of the section heading lines in the Detailed Interpretation Report will be selected as well, automatically. The Detailed Interpretation Report view will be scrolled if necessary, in order to bring the highlighted section heading into view. The table cell in the Overview Report which receives the input focus as the result of the user's selection determines which section heading in the detailed interpretation view is selected: