![]()
Figure 1. The Report Page immediately after initialization
(no trace file loaded)
![]()
Figure 1. The Report Page immediately after initialization
(no trace file loaded)
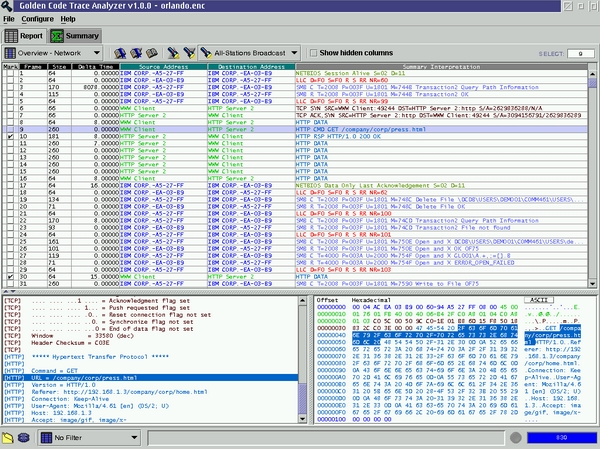
Once a user loads a trace file via the File - Open dialog, the Report page's contents are updated with trace file data, as depicted in Figure 2.
This page displays three views simultaneously, separated from one another by adjustable splitters. The user may drag any of these splitters to change the proportion of the screen which each view consumes. The report views are:
Above the Overview Report is a toolbar, which is used to manipulate the format and contents of the Overview Report. Please refer to the Overview Report - Report Toolbar section for details.
The toolbar which appears at the bottom of the Main Frame Window in
the above figures technically is not part of the the Report Page, since
it remains in view when a different page in the notebook is selected.
For information regarding this toolbar, please refer to the Global
Toolbar section.