Troubleshooting
Overview
There are three main steps in the troubleshooting process.
-
View logs to review the posted messages, warnings and errors. See
Application
Messages and RCs and Device Driver Messages
to assist in interpretation.
-
Run NTRACE with the query option to get a report of its assessment of the
binding environment.
-
Run NTRDIAG to provide a detailed report on the installation and environment.
Query
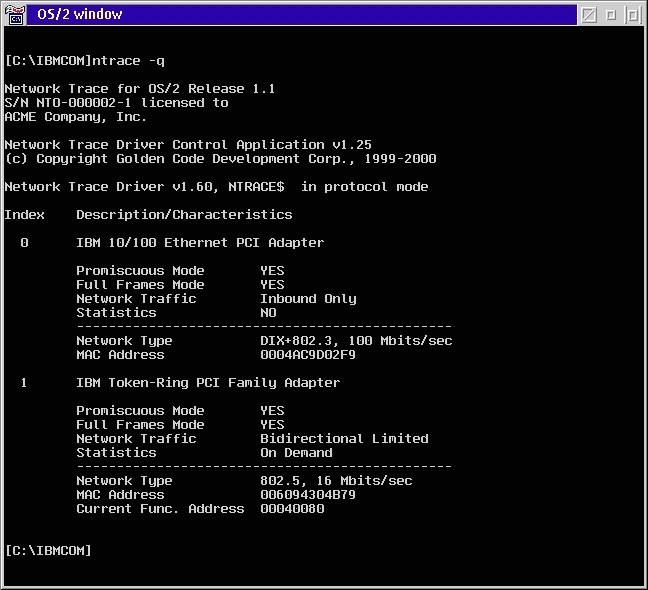
NTRACE.EXE provides a query mode, which allows the display of a list of
MAC adapters which are available for tracing. This allows the user
to identify adapters by the "index" which is used by NTRACE (see Command
Syntax section for the -a option). It also provides a mechanism
to verify that the NTRACE.OS2 is bound to MAC adapters as expected.
Possibly of greater importance is the display of the basic characteristics
of each adapter.
Sample output for protocol mode:
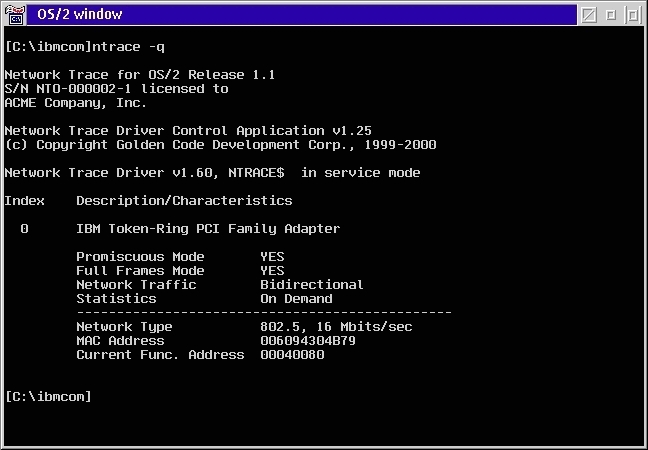
Sample output for service mode:
Interpreting "Network Traffic" Characteristic
The "Network Traffic" characteristic is a guage of the LAN adapter's capability
to support full bidirectional frame capture. The Network Trace v1.0
had only some of this data in the query report. It reported on the
Loopback characteristic. Starting in v1.1, a more useful metric is
being reported. It has 4 possible values based on 2 criteria:
| |
Loopback Support
|
No Loopback Support
|
|
Protocol Mode
|
"Bidirectional Limited"
This means that outbound frames can MOST OFTEN be captured. However,
since loopback can sometimes be an unreliable source of frames, the bidirectional
capability is "qualified" by the word "limited". |
"Inbound Only"
Outbound frames are never captured. |
|
Service Mode
|
"Bidirectional Excessive"
Not only can traffic be captured in both directions, but since loopback
is on, most or all outbound frames will be captured twice. NTRACE
has no way of determining which frames it should keep and which frames
are duplicates. To resolve this issue, it is very important to disable
loopback support in the associated MAC driver. This is often accomplished
by a setting in PROTOCOL.INI.
This "capability" will also cause a performance impact, especially in
heavily loaded networks. The MAC and protocol drivers will have to
handle the outbound frames twice! This could cause significant problems
and lead to lost frames.
LOOPBACK should be disabled for these MAC drivers. |
"Bidirectional"
Full bidirectional capture with no limitations or issues. |
Diagnostic Utility
A utility is provided which will extensively check an installation's validity.
While no diagnostic routine is fool-proof, this tool will find 90% of the
flaws with a Network Trace installation. The utility is named
NTRDIAG.EXE and exists on the CD-ROM in the \utility directory. It
requires 4 other executables to properly execute:
-
RXMISC.DLL - a library of shared functions
-
MACDUMP.EXE - a program that queries information from the NDIS protocol
manager, PROTMAN.OS2
-
NTRDUMP.EXE - dumps the data segment from the NTRACE.OS2 driver
-
BINDTREE.EXE - queries a detailed report of the NDIS binding tree as provided
by PROTMAN.OS2
These supporting executables usually reside in the same directory as NTRDIAG.EXE.
The
tool can be run directly from the CD-ROM as long as the current directory
is WRITABLE. This allows for temporary files and other access as
appropriate. If C: is a drive with write access (on WSOD this may
NOT be always true!) and K: is the CD-ROM drive then:
[C:\]k:\utility\ntrdiag.exe
Running NTRDIAG.EXE
It is important to run NTRDIAG.EXE ONLY after Network Trace is both installed
and has been booted at least once since the last change to CONFIG.SYS or
PROTOCOL.INI. If this assumption is not valid, then NTRDIAG may return
inconsistant results. Remember that NTRDIAG.EXE does not work on
a WSOD client!
NTRDIAG.EXE runs in the following modes:
-
data collection mode
NTRDIAG output-file-spec
In this mode it creates a file to be sent to the technical support team.
This mode is designed to be run on target machines.
-
on-site analysis mode
NTRDIAG
In this mode it inspects the target machine for installation problems
and lists its recommendations.
-
technical support diagnostic mode
NTRDIAG /i:input-file-spec
This mode is designed to be exploited by technical support. It inspects
the input file data previously collected at the target machine (data collection
run) and lists its recommendations. Some interactive analysis is previewed.
In any mode you can specify the /noansi option to suppress ANSI screen
control codes.
What NTRDIAG Checks
-
there are >= 1 (same) RXMISC.DLL instances
-
CONFIG.SYS is a readable text file in the root directory of the OS/2 boot
partition
-
DEVICE=...PROTMAN.OS2 can be located in CONFIG.SYS
-
PROTOCOL.INI can be located and read
-
DEVICE=...LANMSGDD can be located in CONFIG.SYS
-
LANTRAN.LOG can be located and read
-
CALL NETBIND.EXE is present in CONFIG.SYS
-
RUN LANMSGEX is present in CONFIG.SYS
-
DEVICE=...NTRACE.OS2 can be located in CONFIG.SYS
-
LANMSGDD precedes PROTMAN.OS2 in CONFIG.SYS
-
NTRACE.OS2 follows PROTMAN.OS2 in CONFIG.SYS
-
NTR.MSG can be located
-
all NTRACE.OS2 file instances are the same
-
all NTR.MSG file instances are same
-
there are >= 1 (same) NTRACE.EXE instances
-
there are >= 1 (same) BINDTREE.EXE instances
-
there are >= 1 (same) MACDUMP.EXE instances
-
there are >= 1 (same) NTRDUMP.EXE instances
-
there are >= 1 (same) valid instances of LICENSE.NTO
-
there are >= 1 properly named instances of NTRACE.OS2 in CONFIG.SYS
-
LANTRAN.LOG shows no error messages from NTRACE.OS2
-
PROTOCOL.INI contains valid sections for all installed instances
of NTRACE.OS2
-
MACDUMP shows correct NTRACE.OS2 bindings
© 2000 Golden
Code Development Corporation. ALL RIGHTS RESERVED